E3 CRO Case Study #1: Rank Retrieved With an Hour’s Work & at Zero Cost
Categories content structure, Conversion Rate Optimization
Been almost a year since my article on the E3 CRO method was published. A big thank you to everyone for their support! 🙂
 I wasn’t able to do justice to all the appreciation: certain unfortunate events kept me away .
But I’m happy to say that the very first E3 Case Study is finally here.
Using E3 CRO To Retrieve Rank by Increasing Visitor Engagement
This was the first case study to test the validity of the E3 Conversion Rate Optimization strategy. Results were optimistic and you can replicate this experiment without spending a dime.
NOTE: I conducted the experiment without any thought about writing a case study on it; consequently, as a study, it certainly is less than perfect – but does have some interesting insights to offer.
Test Site
My own sub-directory https://kapush.org/cat-litter/
This is an affiliate site I created to test out my SEO and CRO hypotheses. At the time this experiment was conducted, it had only nine pieces of content including the home page write-up.
Summary
An article published on October 26, 2016 was ranking among the first two positions of Google SERP by January 2017. Thereafter, it was demoted to the seventh position in spite of being the most informative among the first ten results. E3 CRO was used under the hypothesis that the loss of rank (and traffic) had occurred because of reduced visitor engagement. Minor adjustments increased organic traffic by 105% and got the article to the fourth position in 28 days. After another adjustment, the article stayed between the first two results for more than a year with no further intervention.
Ignore this line
Tools Used: Google Analytics. Hotjar Basic. KWFinder.Com
Time Invested: 60 minutes (approx).
Cost Incurred: Zero.
The Problem
The standard approach to retrieving rank (which had worked earlier with other articles) would have been to revise the content, repurpose it more, edit internal links and so on. However, the other nine results on the first page of Google SERP did not have better content. Writing ‘even better’ content did not look like a necessary or viable option in this case.
The blog had originally ranked through onsite SEO, quality of content, and content repurposing. No backlink was gained through outreach. All social shares were natural.
How E3 CRO Helped
Based on the hypothesis that a reduced visitor engagement (inferred from reduced dwelling time) was causing the dip in rank, E3 CRO method was used to achieve positive results in less than two weeks. In less than a month the article was ranking at the fourth position. With one additional change, it wavered between the first two positions for more than a year with no further work.
The E3 CRO Strategy Employed
The E3 method moves along the following lines:
Explore – what has worked for others
Examine – how similar elements perform in your case
Extrapolate – the data to find viable conditions for probable success and further testing.
The experiment was conducted strictly according to the rules stated above.
1. Explore
Things beyond my control like competitors’ backlink profile, and their domain authority were not taken into account. After that, three things stood out.
- The article just ahead of mine had listed several brands (like I had) but it also had a ‘Top Picks’ section just before the list (or article body) began.

People are trying to make a buying decision here; the more you narrow down their choice, the simpler it gets for them. Giving them a starting point is better than saying, ‘here’s all I could find, now do whatever’. This, regrettably, is exactly what I my approach had been so far.
- Most of my competitors seemed to prefer the pros-and-cons method of describing a product. But that wasn’t my preferred method of writing product description.
- The other results including the first three were just list posts offering very little value by way of information. I wasn’t about to strip my article of valuable content just to match them. Consequently, only the ‘Top Picks’ element was worth Examining further.
2. Examine
If you are looking at sites in the same category or industry are trying to achieve similar targets, what has worked for them may very well work for you.
An Unexpected Revelation
I clicked one of the Top Picks links, fully expecting to be taken to the section in the article where that particular brand was being talked about. The link led to the seller’s site, instead.
Which means, visitor dwelling time on the site would actually decline, and Google would not get the idea that this site provided a better user experience than mine did.
However, since the links opened new tabs, the visitors were being given the chance to browse both the product description site and the affiliate site at once.
And, since the Top Picks did not lead inside the article, the average visitor might actually try to find the relevant sections and read up the respective descriptions. Which, in turn, might lead to an increase in dwelling time.
Are you put off because I keep saying ‘might’? You can conduct A/B split tests which get results-and are time consuming. Hiring a CRO agency will cost you a pretty penny. The current experiment outlines a free and almost effortless method that costs you all of 60 minutes.
Would you or would you not invest an hour or so to optimize your conversion rate before calling in the big guns and spending a bundle on them?
But surely, we need more data!
Nope. Anyone can see inserting the top picks could help. That is good enough for what we’re trying to do.
If you’re not happy about this intuitive approach that E3 is all about, here’s the research that says limiting choices is a good move.
There’s also a lot of evidence in support of trusting one’s instincts / intuition while making a decision. Google for Dr. David G. Myers and Dr. Judith Orloff if you’re interested.
3. Extrapolate
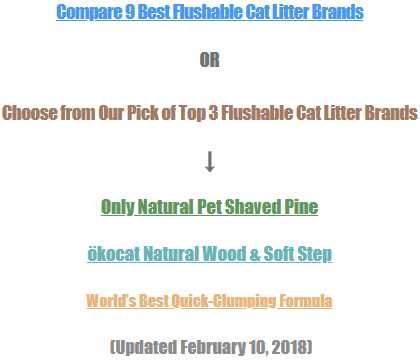
I inserted these four lines (not counting the one in brackets) into the content before the list (and the comparison chart for the brands – more on that later):

The three links in blue led to the relevant sections of my article where each brand was discussed in detail.
What were these four lines expected to achieve?
Using Google Analytics, these were the areas that were expected to show marked improvement from the control:
- Page Views,
- Unique Page Views,
- Avg. Time on Page and,
- Entrances
for
- All Users,
- Organic Traffic and
- Returning Users.
And these are the two popular areas which I chose not to focus on:
- Bounce Rate
- Exit
Why? I’m coming to that shortly.
Results of E3 CRO on website traffic
The immediate focus had been on Increasing visitor engagement (and not on increasing the number of visitors).
The following is a comparison of two weeks before and after the baseline was altered:

As may be evident, the test results were positive with regard to visitor engagement.
Here’s one that compares the Control between January 01, 2017 and February 4, 2017 (35 days) with the Test between February 5 (the day I made the changes) and March 11, 2017 (35 days):
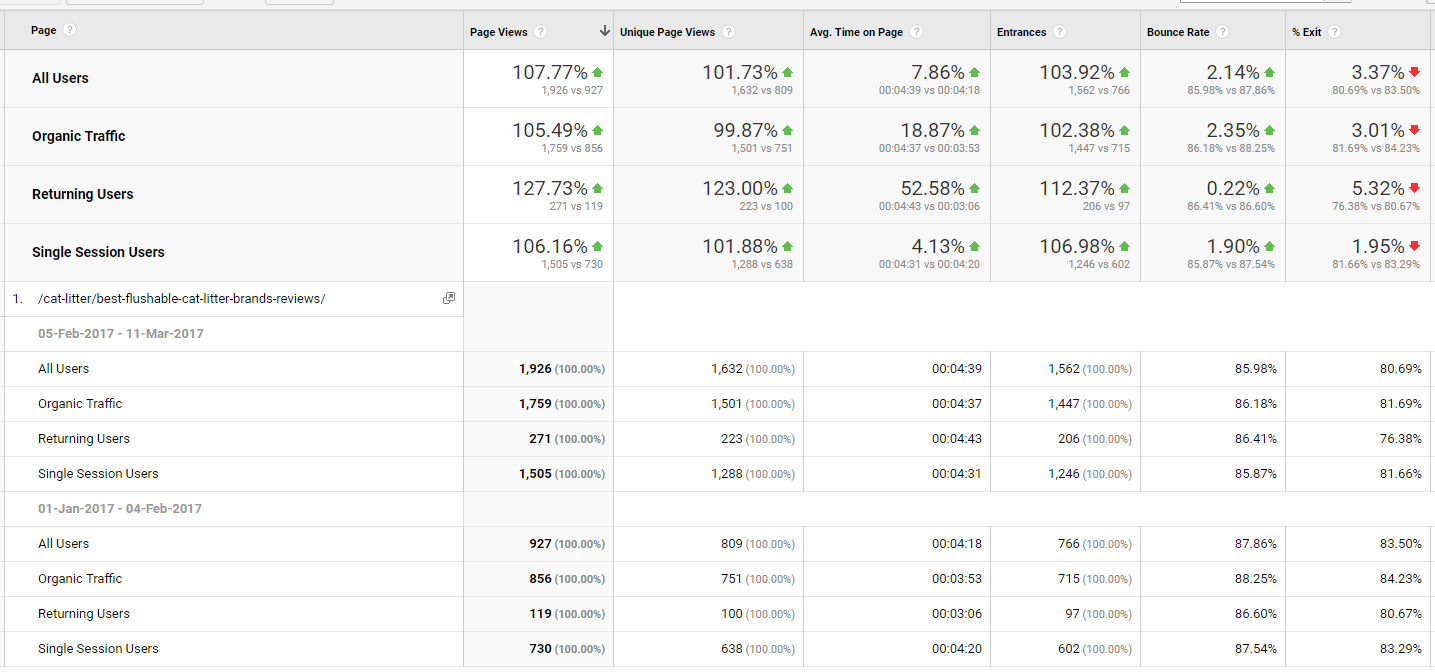
Consequently, my article shot up to the fourth position in a month. With just one more change effected later, it has wavered between the first and second places till date – my competitor being Amazon.Com.
This is from March 4, 2018:

And this, from March 9, 2018:

The keyword difficulty is shown as less when I am on top presumably because I’m easier to push down than Amazon!
How do I know these results were achieved by inserting those four lines?
Well, since the Test had nothing else added to it until more than two months later, it was either those four lines or Google’s whims.
Thankfully, though, there’s a more concrete way to ascribe the success to E3.
Take a look at the density of clicks the heatmaps show:
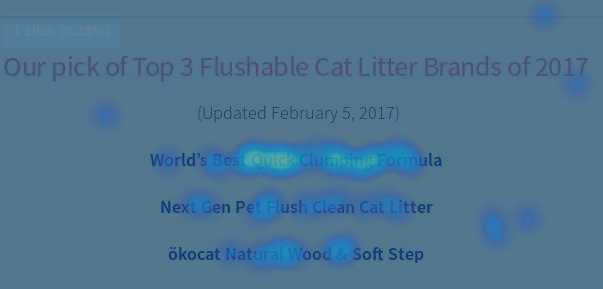
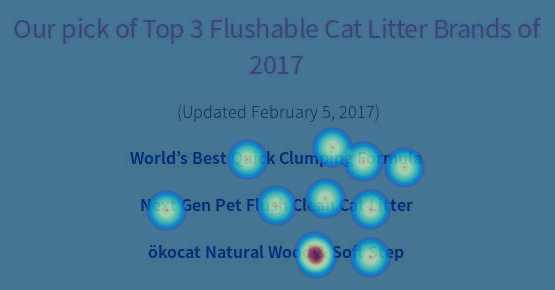
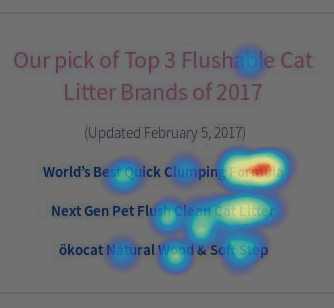
(For 1000 page views between February 27 and March 15, 2017 using Hotjar Basic)
Why were Bounce Rate and Exit left out?
There is enough reason to believe that Google does not consider bounce rate a ranking factor.
That said, both bounce and exit ought to tell you something about the page’s value. If they are too high (as they are in my case), it is generally assumed that the visitors leave because they do not find the content satisfactory.
However, it is important to understand the purpose for which the visitors are acquired, in the first place. In this case, I wanted my visitors to take a look at my content and then click one of the affiliate links and leave – to buy something, hopefully, and make me some commission.
Obviously, not everyone would click a link and leave. Some would simply leave.
Either way, I did not target my visitors so that they would hang around my site reading stuff. I wanted them to leave – after spending some time reading.
In case of highly targeted visitors, there is no particular reason for the reader of Article A to also be interested in Article B.
I would have considered at least the data on exit if the experiment had failed.
Since it hadn’t, and since I usually have very little time after getting client-work done as an SEO Content Writer, I decided not to mend what didn’t seem broken.
The additional change that established ranking between first and second position
I had originally inserted a chart that compared not just flushability of the brands but other attributes as well (like how much they track, if they are dusty or not and so on).
This was to present the readers with a more comprehensive picture of each litter for a better informed purchase decision.
The original chart had the column names (attributes) at the top only.
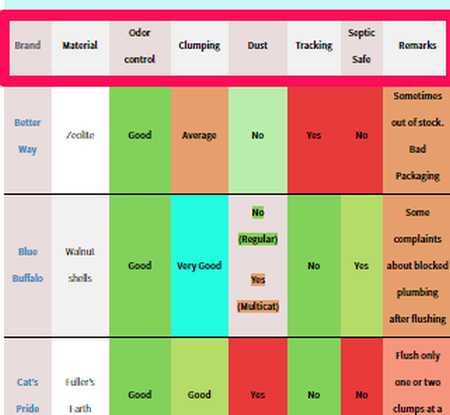
This was inconvenient.
When you are at the 7th brand looking at the green and red cell blocks, you don’t quite remember if the second cell is ‘dusty’ or ‘septic safe’.
Hotjar videos confirmed that this was so – visitors kept scrolling up and down the chart while looking at it.
I simply inserted the respective attribute names in every cell and that solved the problem:

Finally, I kept the PDF for direct download in a no opt-in required state – not being a fan of growing subscribers that way (shocking, I know!)
The font and colours of the original test lines were also changed several times – but I did not measure if that made a significant difference. What can I say – I’m lazy.
This is how they stand at present:
These are tweaks any blogger will make from time to time but they probably add up.
So, I’m guessing (yes, that’s how you work with E3 CRO) that visitors found the Top Pick section helpful which made them more willing to explore the article further.
This increased dwelling time and Google decided to reward the article for better visitor engagement (by giving it the fourth position).
And the PDF, now that it was no longer annoying to explore, must have enticed the visitors to hang around longer than they did earlier.
This enhanced the visitor engagement signals further and Google bumped the ranking higher up and kept it there for a long time.
Conclusion
So, does this prove that E3 CRO works?
Well, it sure does seem like it does. To prove anything, further testing is obviously needed. No one in their right mind would claim to prove anything after just one case study.
And even that study wasn’t properly done.
Strictly speaking, at the very least, I needed to remove those four lines and collect fresh data for comparison.
The purpose of this case study was to show a distinct possibility that E3 CRO has potential. That you can safely use it to attempt conversion optimization on your own without any significant expense, not even in terms of time and labour.
I’ll be happy if that purpose has been achieved.
If you should be inspired to use the E3 method, please leave a comment to let us know if it worked for you – and even if it didn’t.